Analytics and insights
The Analytics page helps you monitor how your reference library is growing, who contributes to it, and how complete your data is. It gives you a clear overview of your references, contributors, monthly activity, and data quality.
Written By Hublyd
Overview metrics
At the top of the page, you can see key indicators for your reference library:
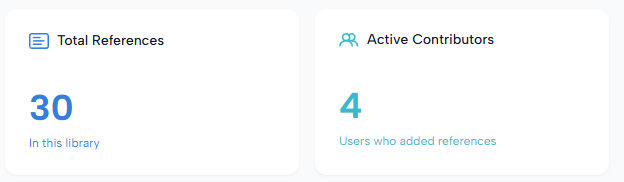
Total References: the total number of references currently stored in the library.
Active Contributors: the number of users who have added references.
These metrics help you quickly understand the size and activity level of your reference group.
References added over time
The References Added Over Time chart shows how references have been added over a selected period.
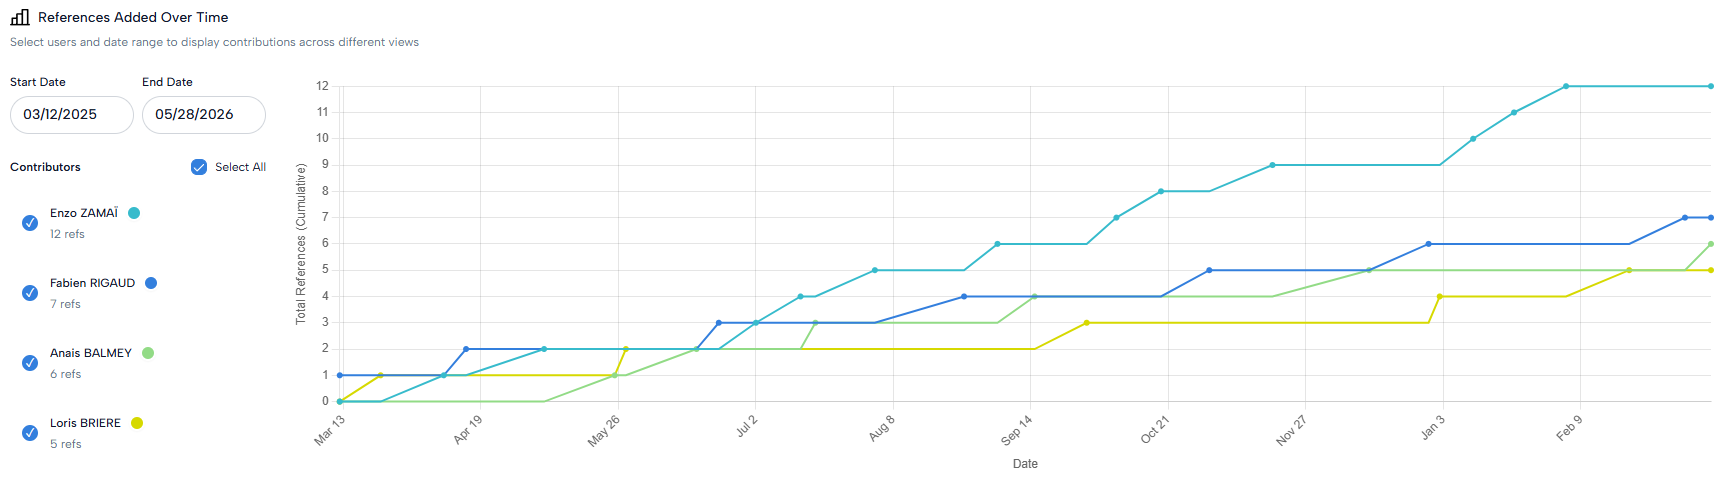
You can:
Choose a start date and end date.
Filter by contributor.
Select or unselect contributors.
View the cumulative number of references added over time.
This helps you track the growth of your reference library and identify contribution trends.
Monthly reference contributions
The Monthly Reference Contributions table gives a detailed breakdown of references added by each contributor per month. You can select a date range to focus on a specific period.
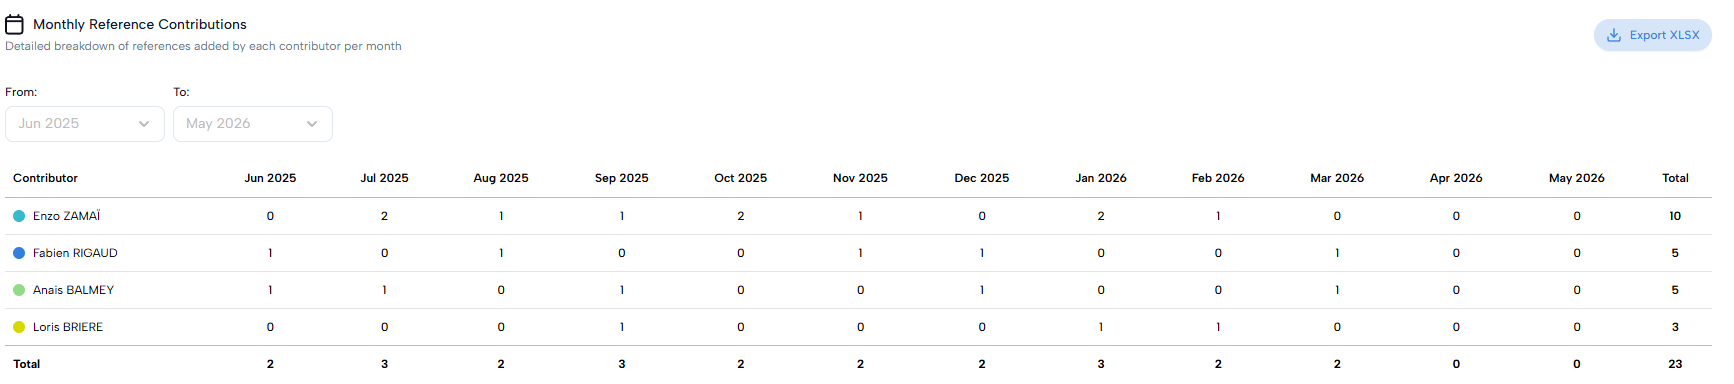
The table shows:
Each contributor.
The number of references added per month.
The total number of references added by each contributor.
The overall monthly total.
You can also export this data as an XLSX file.
Data completeness
The Data Completeness section shows how complete the references are for each contributor.
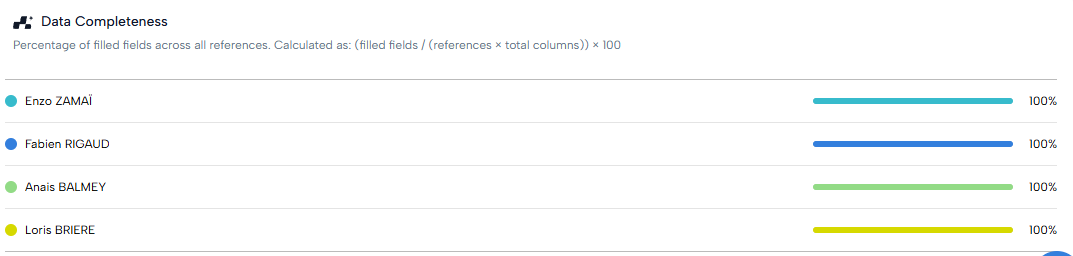
It calculates the percentage of filled fields across all references. This helps you identify whether references are complete enough to be used effectively for search, filtering, and content generation.